Observability Pipelines With Veneur
I work on observability because I want to empower organizations and engineers to operate their services with confidence. Since I don’t work for a company in the space, I’m also interested in retaining leverage and flexibility wherever possible, as well as controlling cost. To that end I’d like to tell you how I leverage Veneur, an OSS project, to make the above possible.
What is Veneur?
Veneur is a two year old open-source project I started at Stripe. Originally the goal was to explore the bounds of push-style metrics. Some systems like Prometheus use a pull-style where agents connect to services and poll their metrics via HTTP. These systems often aggregate metrics in the host process’s memory, computing percentiles and accruing counters. Push-style systems like the venerable StatsD instead emit metrics in real time from services. StatsD uses UDP packets that say, “I just had a page view” or “I ran operation foo in 100ms”. This is called push because metrics are actively pushed to an external receiver. There are pros and cons to each approach. I’m usually biased against pull due to problems scaling past pull-based metric systems at Twitter. But while I favor push, one of the cons of push systems like StatsD is centralization. A centralized StatsD can be tough to scale due to volume and requiring strategies like sharding client libraries. This adds a lot of complexity and toil for operators.
When I began work on Veneur, Stripe was using Datadog’s implementation of StatsD: DogStatsD. Datadog’s solution to scaling a push system is to run a DogStatsD agent on each machine as a sort of sidecar and have that machine forward its metrics to Datadog’s collection endpoints. Each host computes its own aggregates (percentiles, sets, counters) in memory. This avoids centralization but has a downside: you can’t see a global latency percentile from all hosts. You can only see one host or do some mathematically invalid junk like averaging the 99th percentile latency value of each host together.
From this limitation and the curiosity of how to scale push, Veneur was born. Veneur initially aimed to provide desirable features like global aggregation and had the added bonus of cost reduction. Many metric storage systems bill — in house or commercial they all cost something — by metric cardinality and/or the volume of metrics written. By pre-aggregating on some dimensions Veneur can reduce cardinality by orders of magnitude.
You can learn more about how to deploy Veneur in a previous post which details how Veneur can start small in your organization and become the global aggregation mechanism.
Unifying Your Observability
Now that we’ve got the front matter out of the way let’s talk about the primitives that typically make up observability: logs, metrics, and spans. When we’re feeling ostentatious my team calls this the Grand Unified Theory of Observability: Logs, Metrics and Spans are just facets of the same data.
Logs are easy to emit and improve, have ample tooling and are friendly to high cardinality. Metrics are small, easily aggregated and lend well to charts. Spans supply causality and structure. Each have a timestamp and some data and it is my position that their differences are largely due to storage concerns and style. As operators of these tools we’ve both imposed our limitations onto our customer engineers and neglected to unify the libraries that engineers use. More on that in the future!
Logging trends toward tracing as your logging libraries get richer and metrics, well, they’re just cheap. It’s my opinion that each of these primitives is a trace span. Logging “I just ran the query to customers in 12ms” in your code is a shitty span, but a shitty span is still a span. My teammate Aditya Mukerjee spoke about this concept in his Monitorama 2017 talk Tracing Production Services at Stripe.
Now, dear reader, you might disagree with this. But I wager that if you do, you likely disagree more with what I’ve deemed the core of the Grand Unified Theory of Observability: spans. This philosophy is documented in Veneur. Maybe you think logs are the core. Before you fire up your keyboard to complain, though: There’s no reason to get bogged down in this distinction. More on that soon.
There are two major technical problems in improving the observability of your organization: instrumentation and storage. Here’s where Veneur comes in to play: it can provide you not only with an aspirational goal to unify your tooling, but also with a way to migrate from now to that glorious unified future. We’re going to separate unification and migration in the following paragraphs. The goal is to support your organization in whatever phase of the aforementioned Grand Theory of Observability your organization happens to be in.
Instrumentation, Inputs and Sensor Sensibility Format
Veneur is a polyglot when it comes to instrumentation. As I mentioned before, it began life consuming DogStatsD. Since DogStatsD is a superset of StatsD, this means that it can also parse StatsD packets. It can consume these packets via both UDP and TCP. You can deploy Veneur and send your *StatsD metrics to it with no other changes. If you’re currently living in this world, this is your step 1.
For all your shells script needs Veneur provides veneur-emit. With it you can avoid tricks with teeth like this:
echo "deploys.test.myservice:1|c" | nc -w 1 -u statsd.example.com 8125
I say “with teeth” because we’ve had to debug a lot of fun inputs due to escaping, ending and other mess due to these frangible patterns. Using veneur-emit means you won’t have to debug these problems all across your infrastructure.
If you’ve got some pull-style Prometheus stuff then veneur-prometheus allows you to poll Prometheus metric endpoints and forward them to Veneur.
These capabilities mean that Veneur is able to deal with your existing metric formats and clients without changes. If you have some other mechanism, we’d love to hear about them and get them added.
Now that you’ve got things working with Veneur let’s get to the unification bit of our message. To this end Veneur provides the Sensor Sensibility Format (SSF). It is a language agnostic format — using Protocol Buffers — that provides a unified representation of observability primitives. At its most advanced you can imagine it providing a single span with all relevant data:
{
  “name”: “api.RetrieveCustomer”,
  “start_time”: “2018-01-28 11:45:00.000”,
  “end_time”: “2018-01-28 11:45:01.000”,
  “indicator”: true,
  “error”: false,
  “service”: “api-srv”,
  “metrics”: [ … ],
  “logs”: [ … ]
}
That’s our ideal, a span with accompanying metric and log data. Since the world is a messy place and change takes time, pretty much all of these fields are optional. You can start sending just metrics or spans, then eventually put the rest of the data there. Our client libraries for Go and Ruby demonstrate this ability to grow, as each only currently supports trace spans. We’ll be adding metrics and logs over time, but we’re using them for production services at Stripe every day!
SSF is fast to parse, being protobuf. It works over UDP, TCP and also domain sockets for fast and reliable local delivery. Clients can be async and buffered to stay keep things fast in critical code paths.
If you’ve done this, you’ve got a unified instrumentation mechanism. Your uses of veneur-emit can use the -ssf flag to join the party and even begin using veneur-emit’s flags to contribute trace spans too.
Veneur and Storage Agnosticism
Now for migration. Earlier I told you that spans were the ur-metric. Maybe you didn’t agree. I told you that was ok, right? Here’s why: Veneur takes these primitives and hands them off to one of many sinks. If you think spans are the One True Thing™ then you can configure Veneur with a sink for LightStep and be a happy camper. If you prefer the sweet aggregation of metrics you can configure the Datadog sink and chart away. Veneur doesn’t require any one storage mechanism and sinks convert to the store’s native form.
This becomes extra powerful when you consider that Veneur can run as many sinks as you need. The Datadog sink can do both spans and metrics, using Datadog APM. If you’re on AWS you can use the in-progress AWS X-Ray sink in conjunction with SignalFx for metrics. If you prefer events or structured logs you could send output to Honeycomb — which doesn’t have a sink in Veneur yet but you could add it! Sinks are pretty well documented and easy to adapt to your storage of choice. Jack in to your service mesh and see everything. Maybe you’d rather write all your spans or metrics to Kafka and create your own data products downstream? If none of these suit you use the in-progress, cleverly named GRPSink to write a GRPC-based sink that does whatever you want.
Enriching Data
Moreover, Veneur can help you by automatically converting spans into metrics for aggregation and storage in your sink of choice. SSF contains a field called “indicator” that signals the span’s operation to be a Service Level Indicator. Veneur will create canonical metrics using the span’s service name. This provides your organization with a single way for all your services provide data for Service Level Objectives (SLOs) and Service Level Agreements (SLAs). Just think: canonical success rates, durations and more! By signaling which spans are indicator spans, you’ve created your first pipeline feature that will pay off for every team in your organization.
Less Work for Engineers
A sure fire way to get engineers on board with instrumentation is to make it as easy as possible. Aditya’s Monitorama talk covers this in detail. Sometimes there’s more log.Info, stats.Increment and span.Start calls than actual code! Using SSF we aim to have a single output and less work. No reason to emit a timer when you already have a span and no reason to log that you completed an operation if it’s already traced. If an error occurs, we don’t need to log it, if we already flag the span and emit a metric. We set the error bit on the span and everything else happens in Veneur’s sinks.
Another side effect of adding metrics and logs to spans is that, when diagnosing tail latencies or abnormal transactions, the span contains the unaggregated metrics. Remember that span we showed earlier?
{
  “name”: “api.RetrieveCustomer”,
  “start_time”: “2018-01-28 11:45:00.000”,
  “end_time”: “2018-01-28 11:45:01.000”,
  “indicator”: true,
  “error”: false,
  “service”: “api-srv”,
  “metrics”: [ … ],
  “logs”: [ … ]
}
We can attach the raw metrics in the request — shifting us into a sort of sidecar in memory aggregator for a request — and automatically convert them to point metrics for aggregation using the SSFMetrics sink.
Queue depths in HTTP services are often measured as averages or histograms. If you find a really slow call you can use the metrics attached to the span to get detail. Your HTTP service may average ~1 request in the queue, but you might find that requests around the 99th percentile of latency have deep queues by inspecting the metrics on their spans. Since tools like LightStep know to sample transactions in the tail, you can examine the metrics of the fast and slow transactions to find more clues. This means that with Veneur’s processing and fan out we could provide a KPI to specific failure workflow like so:
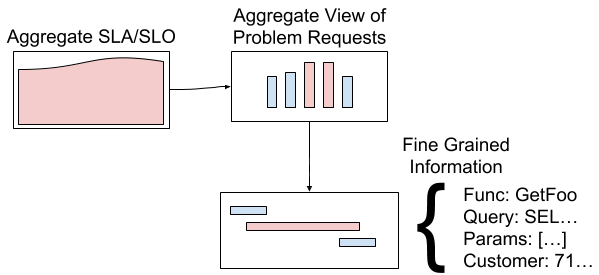
Our high level KPI can link to a set of sampled requests that show latency. Viewing those may give an aggregation of contention for some resource, then we can dig into a specific trace and get fine grained detail. We implement this linking manually in most cases, but hope to make it automatic in the future.
Get You An Observability Pipeline
Veneur’s goal is to provide a vendor-agnostic and storage-agnostic pipeline for your observability data. Veneur is attractive financially because provides you with vendor leverage and cost savings through configurable aggregation. Veneur is attractive organizationally because it grows with you, helps implement best practices for SLI measurement and allows customization through novel sinks like Kafka.
Veneur and SSF are works in progress. It’s current shape fits our needs at Stripe. We’re still unifying clients but we’ve already seen benefits like vendor migration and trialing. We’ll soon be leveraging the SLI metrics for every service. Your organization’s needs will be different, and we’d love your help in making Veneur more flexible. We’ve heard of successes at other companies who leverage Veneur for these reasons.
Regardless of your opinions on which tool or primitive is the best, I hope that you find Veneur a useful way to handle the needs of your services, the evolution of your tooling and the observability store or stores that best fit your organization’s needs. If it doesn’t, open a GitHub issue and let’s talk about what sink or feature you need.
Thanks
Special thanks to Aditya Mukerjee and Jay Shirley for reviewing this post!
Subscribe via RSS!